How can I see my job’s progression in the queue?
Use squeue to see where your jobs stand in the scheduler queue:
squeue -u $USER
This lists your jobs’ states (e.g. PD for pending, R for running), the node(s) they’re
running on, and how long they’ve been running. For more detail on a specific job, including its
pending reason if it’s still queued, use:
scontrol show job <jobid>
Why is loading many small files slow?
The cluster’s parallel file system (PFS) is optimized for throughput on large, sequential reads
and writes — not for handling large numbers of small files. Every file access involves metadata
lookups that carry more relative overhead the smaller and more numerous the files are, so a
directory with thousands of small files can be dramatically slower to read than a single large
file of the same total size. Where possible, bundle small files into an archive (e.g. tar) or a
single dataset format before your job runs, and unpack/read them from fast local/scratch storage
if your workload needs individual file access during execution.
Do I need to actually use the GPU if I request access to CFL?
Yes and no. To be granted access to CFL you need to request GPU resources as part of your application/allocation, since CFL’s compute nodes are GPU nodes — GPU access is tied to how the node itself is provisioned, not to any individual job. That said, this doesn’t mean every job you run has to make use of the GPU: you can request and hold a CFL allocation and still run CPU-only workloads on it. The requirement is about qualifying for the resource, not about how you use it job-by-job.
How can I check the status of my running jobs?
Use the job-usage command to see live statistics for your currently running jobs, including
resource usage. This is the quickest way to check in on a job without digging through the
scheduler’s full output. Using the job id you retrieved above, run:
job-usage <jobid>
which gives you a link to a live dashboard for that job. It looks something like this:
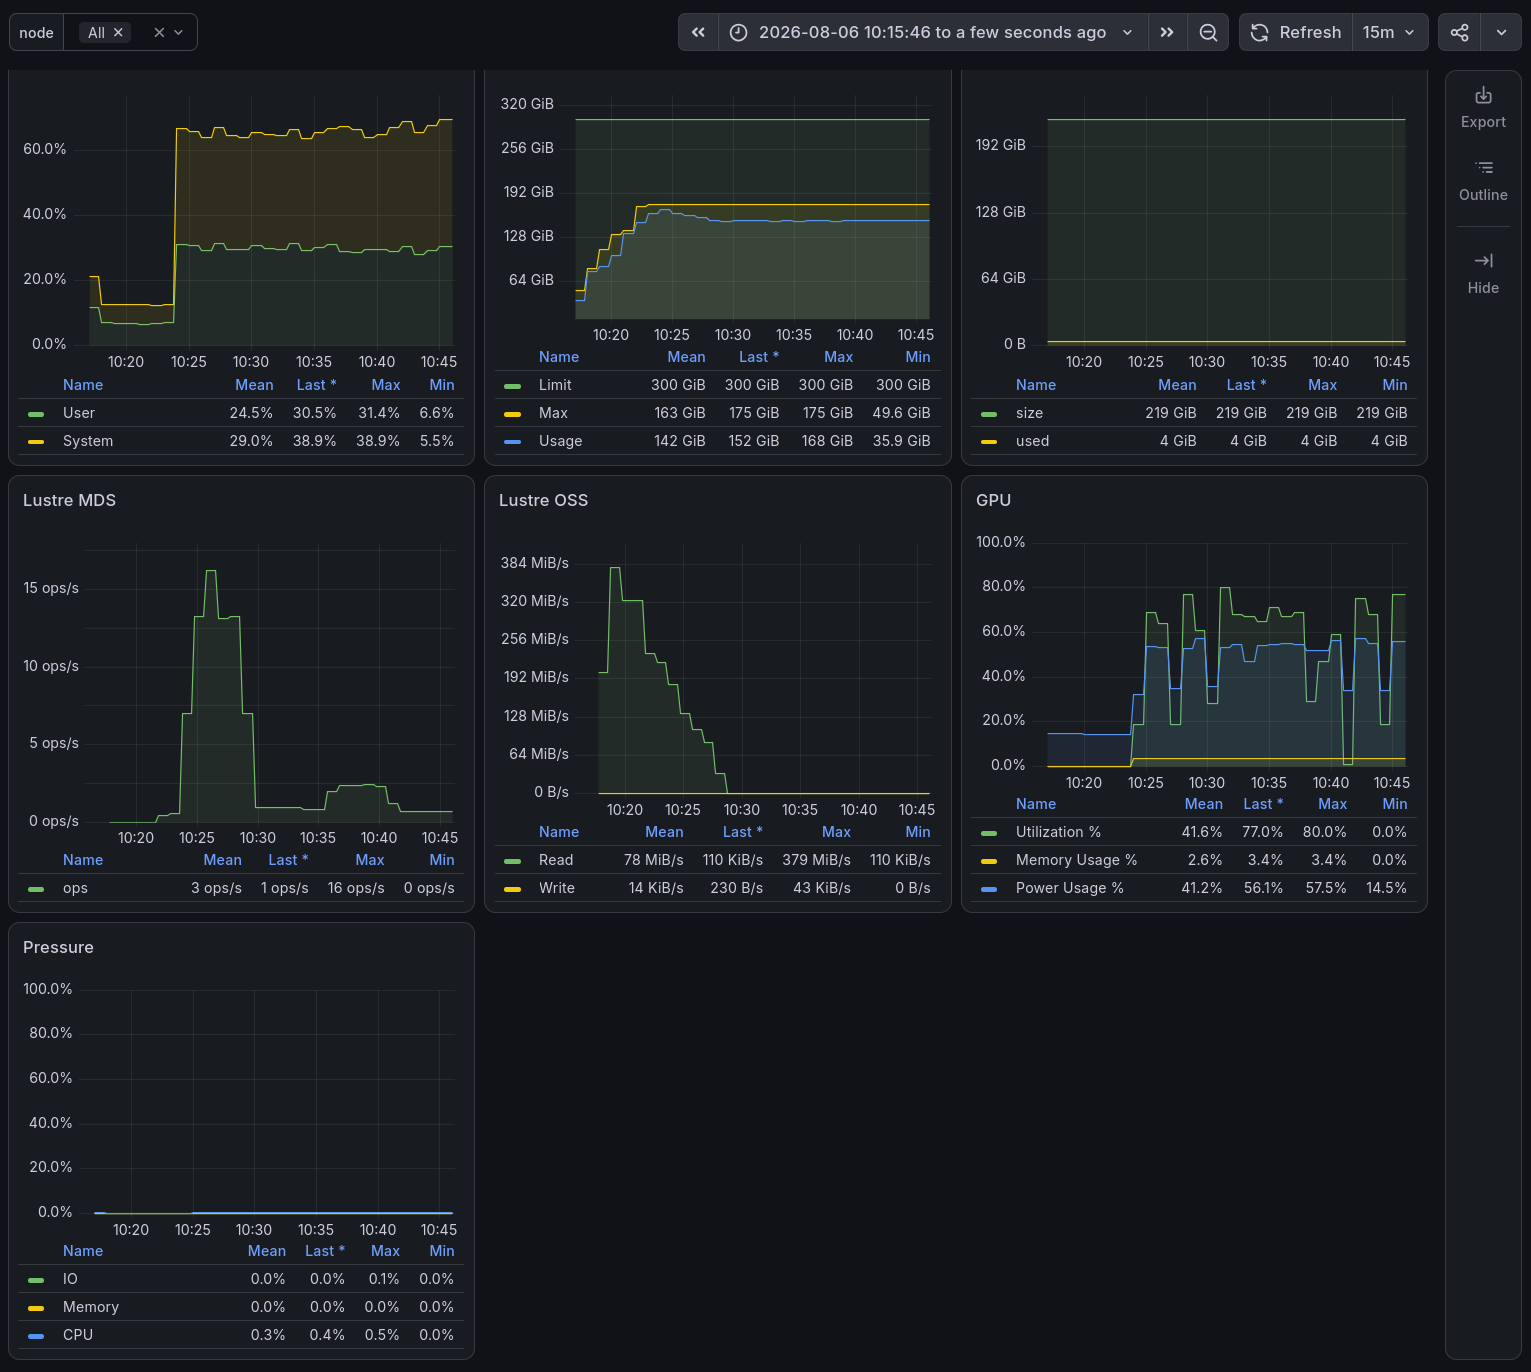
The dashboard is broken down into panels covering the resources your job is using, all over the same time window (selectable at the top, and refreshing automatically):
- CPU — User and System CPU usage as a percentage of what your job has allocated.
- Memory — your job’s memory
Limit, and theMax/Usageit has actually consumed over time. IfUsagekeeps climbing towardLimit, your job risks being killed for running out of memory. - Lustre MDS — metadata operations per second (file opens, stats, creates, etc.) against the Lustre metadata server. Spikes here usually correspond to touching lots of files at once — see why loading many small files is slow above.
- Lustre OSS — actual data read/write throughput to/from the Lustre file system.
- GPU — GPU
Utilization %,Memory Usage %, andPower Usage %. Low utilization with high memory usage often means your job is bottlenecked on data loading rather than compute. - Pressure — Linux pressure-stall information (PSI) for IO, memory, and CPU, showing what percentage of time your job spent waiting on each resource. Sustained non-zero pressure is a sign that resource is your bottleneck.